Note on custom matplotlib style
This serves as a note for setting up my custom matplotlib style. This style features,
- Combines the styles of
seaborn-deep,seaborn-ticks(comes with seaborn library), andscience - Render text and math using LaTeX
- Use font CMU Bright. This font is used for rendering both text and equations.
The content of the matplotlib style sheet file is the following,
# Use LaTeX for math formatting
text.usetex : True

# In general, we need to be careful with the preamble.
# Use CMU bright font
text.latex.preamble : \usepackage{amsmath} \usepackage{amssymb} \usepackage{cmbright} \usepackage[OT1]{fontenc}

# Seaborn common parameters
figure.facecolor: white
text.color: .15
axes.labelcolor: .15
legend.frameon: False
legend.numpoints: 1
legend.scatterpoints: 1
xtick.color: .15
ytick.color: .15
axes.axisbelow: True
image.cmap: Greys
font.family: sans-serif
grid.linestyle: -
lines.solid_capstyle: round

# Seaborn white parameters
axes.grid: False
axes.facecolor: white
axes.edgecolor: .15
axes.linewidth: 1.25
grid.color: .8

# Seaborn deep palette
axes.prop_cycle: cycler('color', ['4C72B0', '55A868', 'C44E52', '8172B2', 'CCB974', '64B5CD'])
patch.facecolor: 4C72B0

# Set default figure size
figure.figsize : 3.75, 2.5

# Set x axis
xtick.direction : in
xtick.major.size : 3
xtick.major.width : 0.5
xtick.minor.size : 1.5
xtick.minor.width : 0.5
xtick.minor.visible : True

# Set y axis
ytick.direction : in
ytick.major.size : 3
ytick.major.width : 0.5
ytick.minor.size : 1.5
ytick.minor.width : 0.5
ytick.minor.visible : True

lines.markersize : 5.5

# Always save as 'tight'
savefig.bbox : tight
savefig.pad_inches : 0.05
However, there is a catch. When using LaTeX to render the text and math, if the file is saved as pdf format, the font is always embedded as Type 1 font. This cause missing font issue if opened by Adobe Illustrator or Inkscape, and the text won’t be properly displayed. To resolve this, I found two methods:
- Save as
.svgformat. The output file can be properly opened by Adobe Illustrator and Inkscape - Save as
.pdfformat, and then useGhostscriptto convert all text to outline. The command is the following,
gs -o new.pdf -dNoOutputFonts -sDEVICE=pdfwrite old.pdf
The issue with both of these methods is that you can not edit the text because the text is outlined. So far, I am not aware of any method that can do both LaTeX rendering and doesn’t have missing font issue.
Below are two examples of this custom style (both are slighted modified from the examples shown on the matplotlib document). If they are too small, you can right click on them and open them in a new tab.
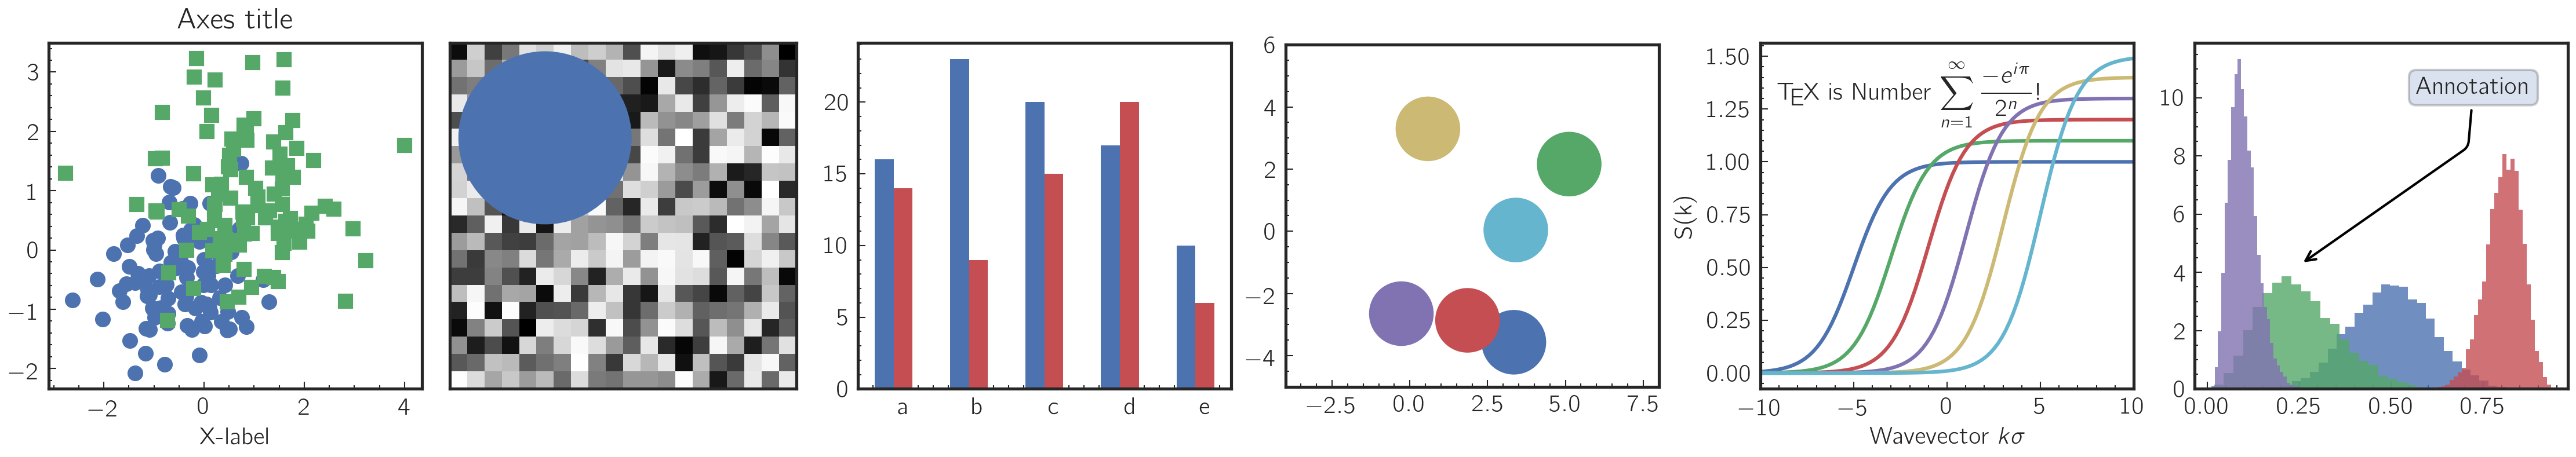
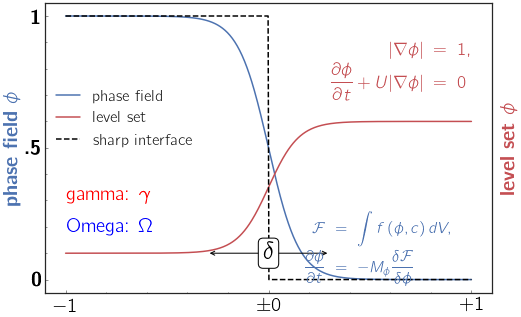
The script for generating these plots can be found here